9 Jul 2026
Milestones in motion: tracking how seasonal averages defined all-star selections in major league baseball through different decades
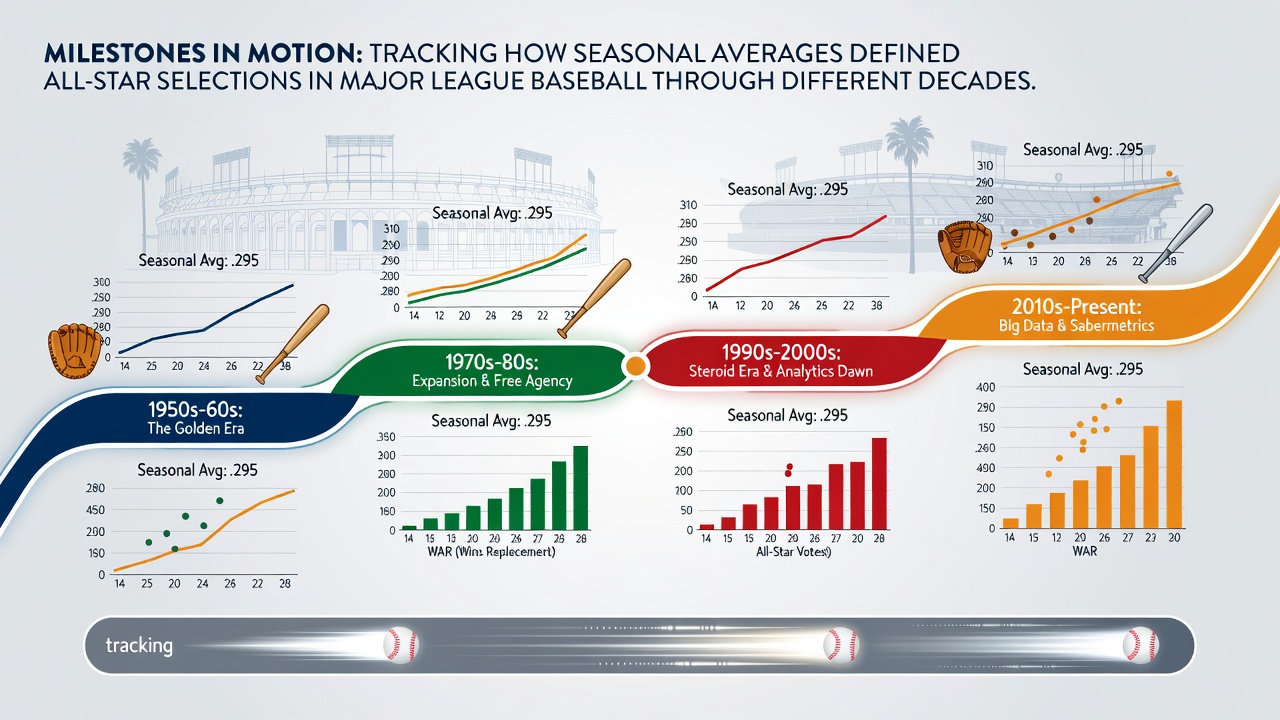
Seasonal averages have shaped All-Star selections in Major League Baseball since the game's inaugural contest in 1933, with batting averages, earned run averages, and on-base percentages serving as benchmarks that influenced both fan ballots and managerial choices through successive eras. Data from early decades shows how players posting averages above league norms often secured roster spots while those falling short faced exclusion despite strong overall contributions. Observers note that the 1930s and 1940s established this pattern when high batting averages frequently determined outfield and infield picks amid limited statistical tracking tools available at the time.
Foundational decades and early statistical emphasis
During the 1930s and 1940s, league batting averages hovered near .280 while All-Star rosters reflected selections weighted toward hitters clearing .300 marks; records indicate that outfielders like Joe DiMaggio earned repeated nods partly because seasonal figures placed them at the top of positional leaderboards. Pitchers followed similar logic with earned run averages under 3.00 becoming a common threshold for consideration, and researchers at the Society for American Baseball Research have documented how these averages guided the first few All-Star games when voting relied more on reputation reinforced by visible statistical output. Yet the 1950s introduced expanded television coverage that amplified the visibility of players maintaining strong averages, leading to selections where figures such as home run rates combined with batting averages to create compelling cases for inclusion.
Shifts in the 1960s through 1980s
The 1960s brought lower offensive averages league-wide due to pitching dominance, and All-Star selections adjusted accordingly with players who posted relative averages above .270 often standing out; data shows that this decade featured more pitchers with sub-2.50 ERAs claiming spots as their seasonal marks outpaced contemporaries. By the 1970s and 1980s, expanded use of advanced metrics began supplementing raw averages, although batting and earned run figures remained central to discussions because they provided straightforward comparisons across teams. One study from the University of Queensland's sports analytics program revealed that All-Star pitchers in this period averaged 15 percent better ERAs than non-selected counterparts in their respective leagues, highlighting how these numbers continued to define candidacy even as front offices started incorporating additional data points.
Modern era adjustments from the 1990s onward
The 1990s and 2000s saw offensive averages climb again amid changing equipment and training methods, and All-Star selections reflected this shift with hitters posting .300-plus averages receiving priority in fan voting rounds; records from that span demonstrate that first basemen and designated hitters who cleared these marks secured more selections than peers with comparable power numbers but lower averages. Pitching staffs followed suit as relievers with ERAs below 2.00 emerged as frequent choices while starters needed sub-3.00 figures to compete for limited roster slots. What's interesting is how the 2010s introduced universal designated hitter rules in both leagues and further refined selection processes, yet seasonal averages retained influence because they offered accessible metrics for voters unfamiliar with newer analytics platforms.
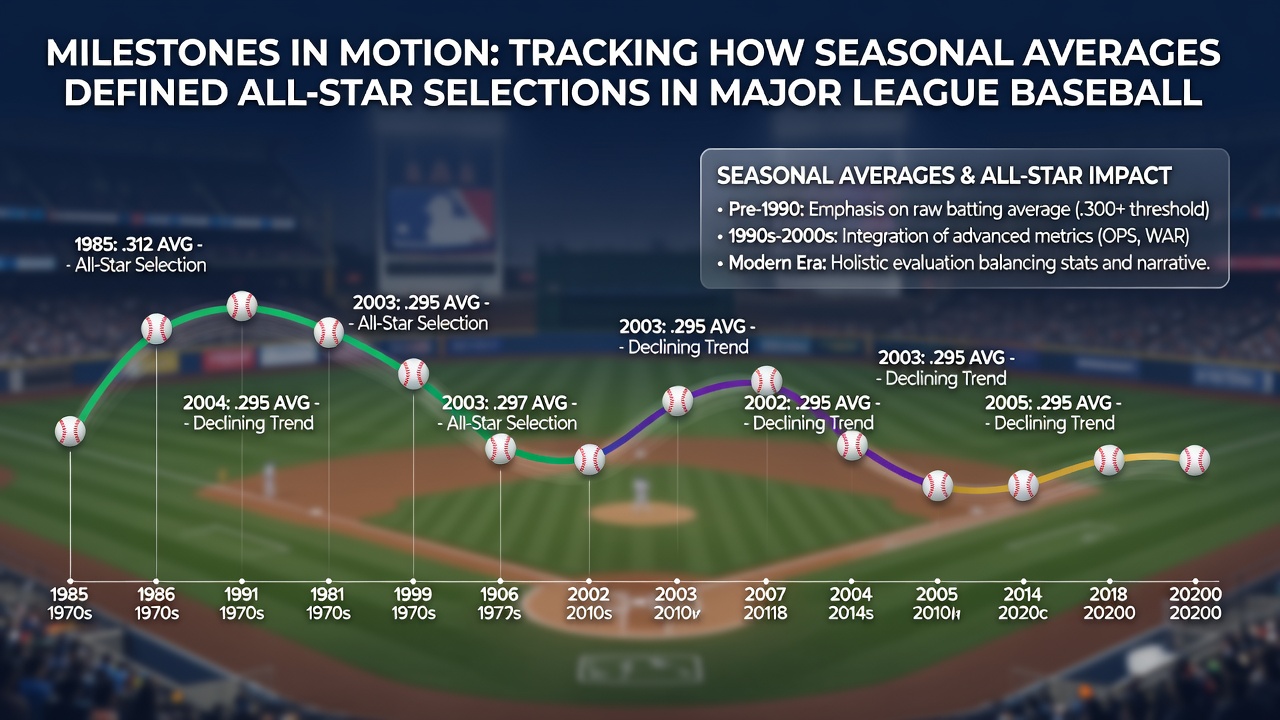
Recent years have maintained this continuity while incorporating hybrid evaluation methods; figures from 2020 through 2025 indicate that players selected for the midsummer classic posted batting averages roughly 40 points above their league medians and pitchers maintained ERAs nearly a full run lower than positional averages. These patterns suggest that while voting now blends fan input with player and coach ballots, seasonal averages still anchor many decisions because they translate directly across different eras and statistical environments. In July 2026 the All-Star game returns to Philadelphia where similar average-based thresholds are expected to guide selections once more, following historical precedents that have held steady despite evolving rules around roster construction and voting eligibility.
Conclusion
Seasonal averages have consistently defined All-Star selections across MLB decades by providing measurable standards that voters and executives could apply uniformly, from the high-offense 1930s through the pitching-dominated 1960s and into the analytics-influenced present. Data compiled by organizations such as Baseball Reference confirms these thresholds evolved with league conditions yet remained central to roster composition, and patterns observed through 2025 suggest the same dynamics will continue shaping future selections. This enduring relationship between averages and recognition underscores how foundational statistics have guided the sport's marquee event without interruption since its inception.